
Finding New Customers: Apple Cell Phone Accessories
Pulling in from thousands of rows and columns of consumer data, simCluster segments represent preferences of people and households across the US. Using financial, media channel, device usage, and demographic data, our simSearch engine identifies similarities among potential customers and groups them into segments. These segments are built on a predictive distance function that ranks customers based on their likelihood of purchase. We tell you why each person has been placed in a given segment, with respect to the item you want to sell. That’s the calculus under your fingertips when you work with simMachines.
Data Overview
All rows and columns are run through our proprietary simSearch engine (Ramiel) that identifies similar documents and renders them for scalable analysis. Then our simCluster engine (Sandalphon) generates dynamic predictive segments.
These are:
- Dynamic in the sense of being able to look at each record in real-time, allowing customers to move between segments and enabling an updated segment after data refresh or model retraining.
- Predictive through having been created according to each customer’s predicted likelihood of purchasing the product in question. Our software does not just describe your dataset, we can reveal your customer’s preferences in their own ranking.
- Segments refer to the breakdown of customers. Our simCluster engine gives you the ability to view the feature importance for each document at both the global and the local levels, which uncovers “the Why” behind the predictions for your customers at both the segment and person levels. Our visualization engine renders these documents accessible at an extremely granular level, allowing customer insight specialists the ability to dissect their data with the precision of a scalpel, not a blunt instrument.
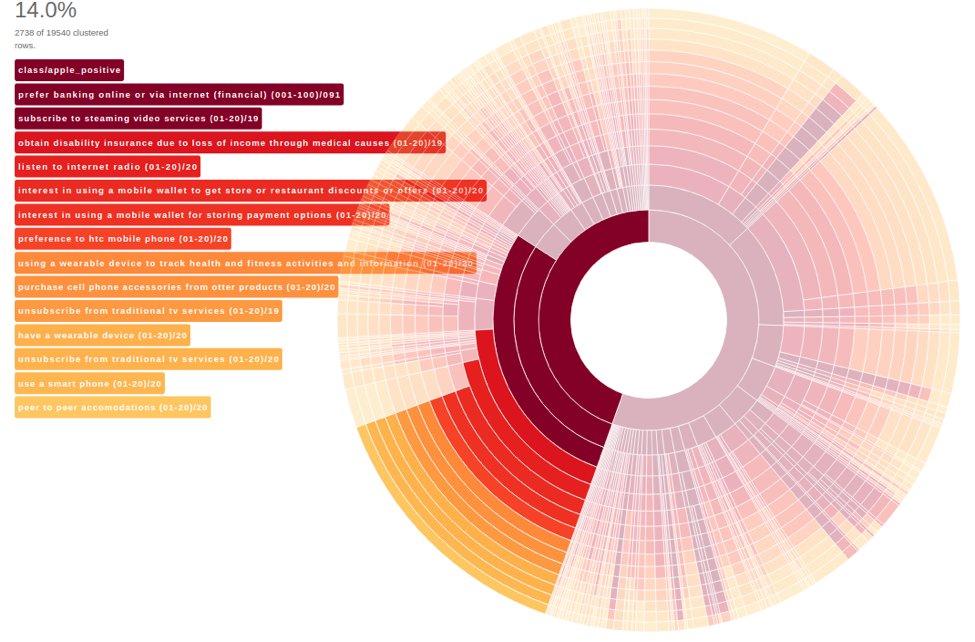
This is the largest segment in our data sample. The highlighted section shows 2,739 rows, all identified by our simSearch engine as having a predicted likelihood for purchasing an Apple cell phone accessory. This is the largest segment in our data sample. The highlighted section shows 2,739 rows, all identified by our simSearch engine as having a predicted likelihood for purchasing an Apple cell phone accessory. Each bar in the cluster corresponds to its respective label on the left side of the image, descending in importance from the most informative, apple_positive, to the least informative, peer_to_peer_accomodations=20. This refers to a propensity scoring, between a range of 1 to 20, where a number close to 20 refers to having a low propensity score for the column in question, while a number close to 1 indicates having a high propensity for that feature. The third most informative feature for this segment is that they are not subscribers of online video streaming sources. This tells us that they are an older audience group, who are not heavy internet users. Finally, we can see that the second-to-last feature in importance is an extremely low likelihood for using cell phones avidly. Clearly this is a segment that requires special attention; they may be uninterested in cell phone accessory advertisement that too strongly emphasizes the buyers reliance on internet, but instead showcases their happiness of their children.
This is a dynamic predict segment of people who are very likely to be Apple purchasers, but may be hesitant to adopt some new technologies. They will be responsive to an ad campaign that fits their lifestyle, not one that pushes them out of their comfort zone.